

This Week on Wall Street - Week of April 8th
Market Commentary
After a voaltile and negative week last week, equity markets were calmer and slightly higher. Recent Fed speak and better-than-expected economic data have caused a quick tempering of bets for Fed cuts this year. At the beginning of the year, there was a widespread expectation that the Federal Reserve's series of interest rate increases over the previous two years would not only reduce inflation but also cause financial stress in the economy, leading the market to bet on as many as 6 cuts in 2024. Now, swaps markets imply about 60 basis points of easing this year, implying about 2 cuts starting by September. The recent repositioning is causing yields to drift higher as the 10YR Treasury hit a year-to-date high at 4.4%.
Looking ahead, we will get an all-important inflation report, the Consumer Price Index, on Wednesday. Expectations are for the gauge to print a 3.4% YoY number, up slightly from the previous month's 3.2% read. Looking at the core gauge, which excludes the more volatile food and energy, expectations call for a 3.7% YoY print which is well above the Fed's 2% target.
Broad indices are still in medium-term uptrends, however, recent breadth indicators are showing short-term weakness. We are entering Q1 earnings season where, according to Factset, the estimated Q1 2024 YoY earnings growth rate for the S&P 500 is 3.2%. This estimate would mark the 3rd straight quarter of year-over-year earnings growth for the index. On the other hand, companies are issuing negative Earnings Per Share (EPS) guidance at the second-highest rate since Q2 2019. We are still in the early innings of earnings season as only 9 companies from the S&P 500 report this week.
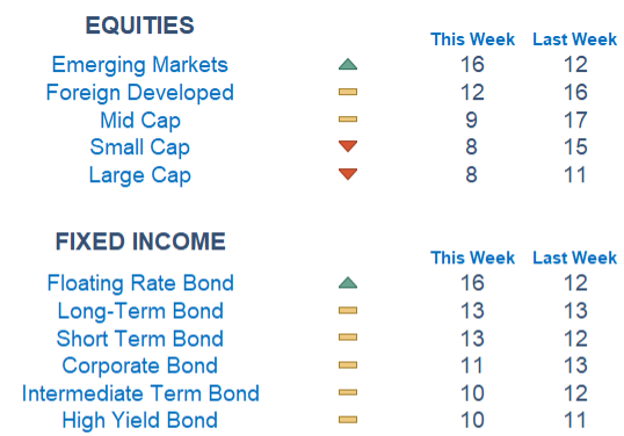
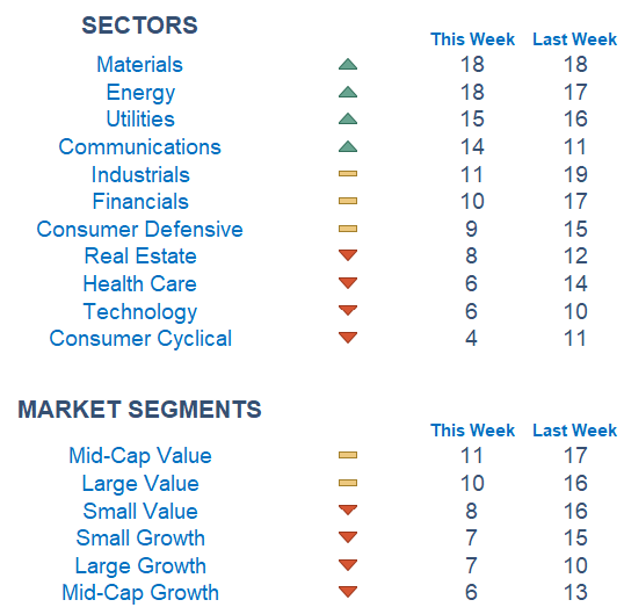
There has been an elevated level of short-term rotation in the market, exemplified by the rate of change in Newton scores on the broad-based indices. This week, we can see that the worst area, Emerging Markets is on top while the best area last week, Large Caps, has now lost strength. The theme of value names remaining strong relatively, however, is continuing this to start the week. Materials and Energy are the strongest sectors for a second straight week. Consumer Cyclical and Technology are the laggards once again.
Economic Releases This Week
Monday: Minneapolis Fed President Kaskari Speaks
Tuesday: NFIB Optimism Index
Wednesday: Consumer Price Index, Core CPI, Fed Gov. Bowman Speaks, Chicago Fed President Goolsbee Speaks, Minutes of the Fed's March FOMC Meeting, Monthly US Federal Budget
Thursday: Initial Jobless Claims, Producer Price Index, Core PPI, Boston Fed President Collins Speaks, Chicago Fed President Goolsbee Speaks, Atlanta Fed President Bostic Speaks
Friday: Atlanta Fed President Bostic Speaks, SF Fed President Daly Speaks, Import Price Index
Stories to Start the Week
South Carolina women's basketball team capped off a perfect season, winning the NCAA Championship over Iowa. The men's game is tonight.
Loss of engine cover on Southwest Boeing 737-800 prompts FAA investigation.
A comic book featuring Superman's first-ever appearance sold for $6 million, making it the most valuable comic edition in existence.
The US is prepared to sanction Chinese banks and companies if they aid Russia's military, US Treasury Secretary Yellen said today.

What is Newton?
Our Newton model attempts to determine the highest probability of future price direction by using advanced algorithmic and high-order mathematical techniques on the current market environment to identify trends in underlying security prices. The Newton model scores securities over multiple time periods on a scale of 0-20 with 0 being the worst and 20 being the best possible score. Trend & level both matter.
Technical trading models are mathematically driven based upon historical data and trends of domestic and foreign market trading activity, including various industry and sector trading statistics within such markets. Technical trading models, through mathematical algorithms, attempt to identify when markets are likely to increase or decrease and identify appropriate entry and exit points. The primary risk of technical trading models is that historical trends and past performance cannot predict future trends and there is no assurance that the mathematical algorithms employed are designed properly, updated with new data, and can accurately predict future market, industry and sector performance.