
We are coming off a volatile week in markets as investors try to price in Jerome Powell's comments at Jackson Hole. Still, in the dog days of summer, trading volume is extremely low, dampening any opinions on the bull or bear sides. For investors, this means data like Friday's labor report could be crucial.

This Week on Wall Street - Week of August 28th
Market Commentary
We are coming off a volatile week in markets as investors try to price in Jerome Powell's comments at Jackson Hole. Still, in the dog days of summer, trading volume is extremely low, dampening any opinions on the bull or bear sides. For investors, this means data like Friday's labor report could be crucial.
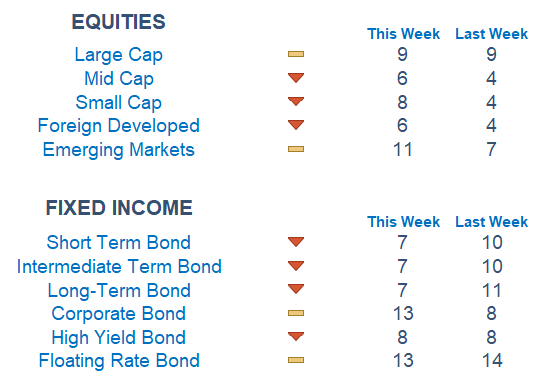
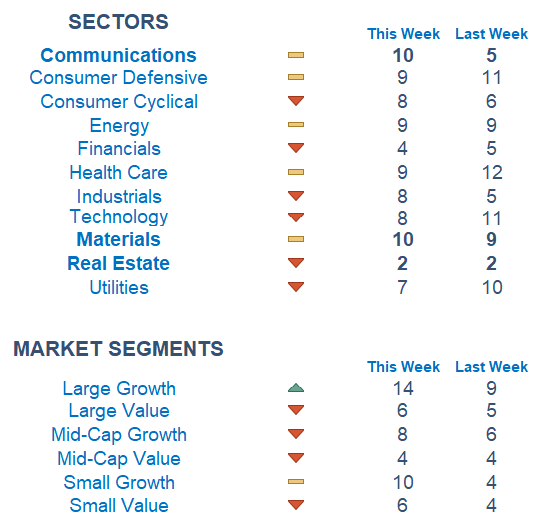
Newton scores show miniscule improvement on broad equity markets from depressed levels. Large-cap growth is one part of the market starting to gain some momentum, but with scores across the board low, greater participation will be needed for additional upside this week. Beneath the surface, Communications and Materials are leading while Real Estate is lagging. For yet another week, Fixed income is still weak as the ten-year yield is at its highest level since 2007.
Jobs Friday: Every first Friday of the month, investors get an important read on the state of the labor market. Over the last six months, the nonfarm payroll number has been positive but decreasing steadily. Last month we saw the number come in at 187,000 while the expectation Friday is for 165,000. The metric is key for the Fed as a stronger-than-expected number will likely mean further support for their tightening policy. On the other hand, slower employment growth and a moderation of wages might reduce the urgency for more rate hikes.
Related is the core PCE release on Thursday, as it is the Fed's preferred inflation gauge. After coming down rapidly, we are seeing it stall at a level that the Fed has said is too high. Based on estimates, the year-over-year number will stay around 4.2% after registering 4.1% in July.
What is Newton?
Our Newton model attempts to determine the highest probability of future price direction by using advanced algorithmic and high-order mathematical techniques on the current market environment to identify trends in underlying security prices. The Newton model scores securities over multiple time periods on a scale of 0-20 with 0 being the worst and 20 being the best possible score. Trend & level both matter.
Economic Releases This Week
Monday: None
Tuesday: S&P Case-Shiller Home Price Index, Job Openings, Consumer Confidence
Wednesday: ADP Employment,
Thursday: Initial & Continuing Jobless Claims, PCE Index, Personal Spending
Friday: Jobs Report, ISM Manufacturing
Technical trading models are mathematically driven based upon historical data and trends of domestic and foreign market trading activity, including various industry and sector trading statistics within such markets. Technical trading models, through mathematical algorithms, attempt to identify when markets are likely to increase or decrease and identify appropriate entry and exit points. The primary risk of technical trading models is that historical trends and past performance cannot predict future trends and there is no assurance that the mathematical algorithms employed are designed properly, updated with new data, and can accurately predict future market, industry and sector performance.