
Wall Street kicked off the new week on decent footing as stocks advanced higher. There are huge economic data releases this week starting with the Consumer Price Index this morning.

This Week on Wall Street - Week of December 12th
Market Commentary
Wall Street kicked off the new week on decent footing as stocks advanced higher. There are huge economic data releases this week starting with the Consumer Price Index this morning. The data should give Wall Street a sense of whether the disinflation trend is continuing or if inflation is stickier than initially thought. Estimates are calling for a 3.1% year-over-year increase in the gauge. The Fed's preferred inflation target is 2%.
Speaking of the Fed, tomorrow the Federal Open Market Committee will announce its interest rate decision. Markets are pricing in a nearly 0% chance the Fed hikes but what will likely move markets is Jerome Powell's press conference and the dot plots. Overall, they will continue to watch inflation trends and the labor market on whether higher for longer turns into cuts sometime near the halfway point of 2024.
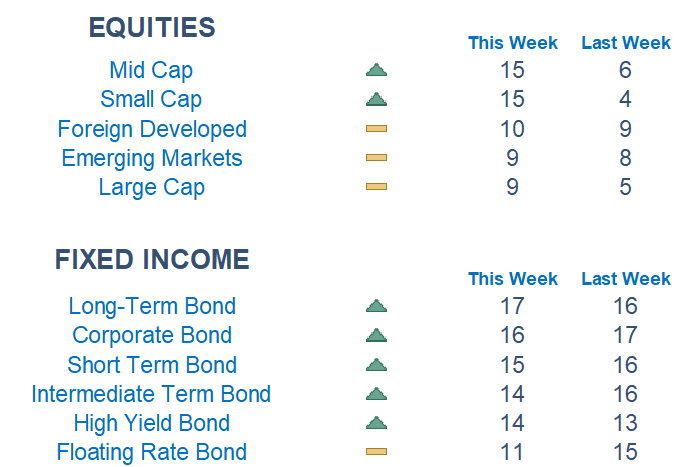
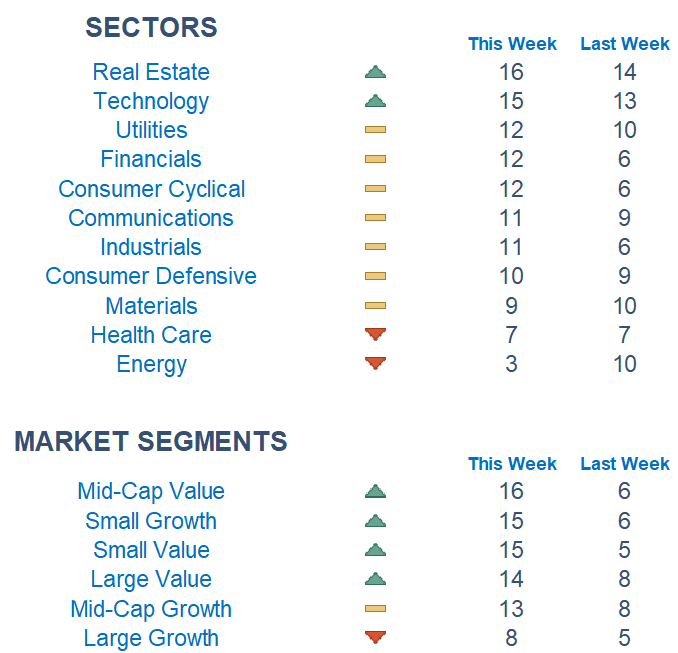
Newton scores are starting to show rotation out of large-cap names for the first time in months. Value is also starting to see strength against growth. Beneath the surface, Real Estate and Technology are leading while Health Care and Energy are lagging.
Economic Releases This Week
Monday: None
Tuesday: Consumer Price Index, Monthly Federal Budget
Wednesday: Producer Price Index, FOMC Interest Rate Decision & Powell Press Conference
Thursday: Initial Jobless Claims, US Retail Sales
Friday: Empire State Manufacturing Survey, Industrial Production, Capacity Utilization
What is Newton?
Our Newton model attempts to determine the highest probability of future price direction by using advanced algorithmic and high-order mathematical techniques on the current market environment to identify trends in underlying security prices. The Newton model scores securities over multiple time periods on a scale of 0-20 with 0 being the worst and 20 being the best possible score. Trend & level both matter.
Technical trading models are mathematically driven based upon historical data and trends of domestic and foreign market trading activity, including various industry and sector trading statistics within such markets. Technical trading models, through mathematical algorithms, attempt to identify when markets are likely to increase or decrease and identify appropriate entry and exit points. The primary risk of technical trading models is that historical trends and past performance cannot predict future trends and there is no assurance that the mathematical algorithms employed are designed properly, updated with new data, and can accurately predict future market, industry and sector performance.