
The rally in stocks continued on Monday as the VIX hit multi-year lows. As the year draws to a close, this rally in stocks, often referred to as the market's "Santa Rally", faces the challenge of potential exhaustion.

This Week on Wall Street - Week of December 18th
Market Commentary
The rally in stocks continued on Monday as the VIX hit multi-year lows. As the year draws to a close, this rally in stocks, often referred to as the market's "Santa Rally", faces the challenge of potential exhaustion. This potential exhaustion is more technical in nature given one of the strongest short-term rallies in years. Traders will be watching the Fed's preferred inflation gauge on Friday. Expectations are calling for a flat read month over month, with a 3.3% increase year over year on the core number.
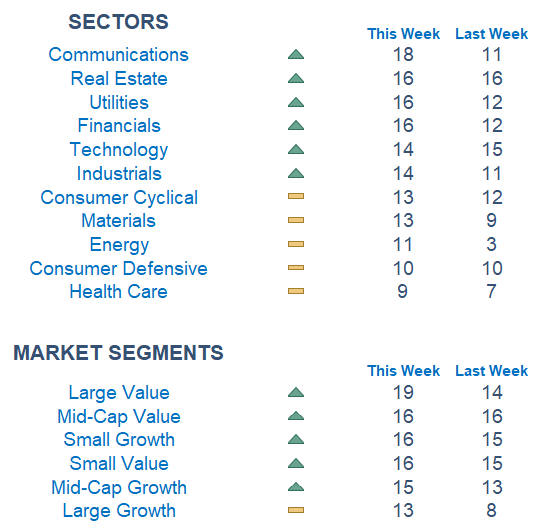
Newton scores are solidifying their rotation into value as scores are high across the board. Communications, Real Estate, Utilities, Financials, Technology, and Industrials are all showing strength. This trend signifies a notable breadth in the marketplace, a phenomenon that has been absent for much of the year. Interestingly, the sectors that were previously lagging are now emerging as the front runners and we will be watching to see if this trend can continue.
Economic Releases This Week
Monday: Chicago Fed President Goolsbee Speaks, Home Builder Confidence Index
Tuesday: Housing Starts, Building Permits, Richmond Fed President Barking Speaks, Atlanta Fed President Bostic Speaks
Wednesday: US Current Account, Existing Home Sales, Consumer Confidence
Thursday: Initial Jobless Claims, GDP (Revision), US Leading Economic Indicators
Friday: Durable Goods, Personal Income, Personal Spending, PCE Index, New Home Sales, Consumer Sentiment
What is Newton?
Our Newton model attempts to determine the highest probability of future price direction by using advanced algorithmic and high-order mathematical techniques on the current market environment to identify trends in underlying security prices. The Newton model scores securities over multiple time periods on a scale of 0-20 with 0 being the worst and 20 being the best possible score. Trend & level both matter.
Technical trading models are mathematically driven based upon historical data and trends of domestic and foreign market trading activity, including various industry and sector trading statistics within such markets. Technical trading models, through mathematical algorithms, attempt to identify when markets are likely to increase or decrease and identify appropriate entry and exit points. The primary risk of technical trading models is that historical trends and past performance cannot predict future trends and there is no assurance that the mathematical algorithms employed are designed properly, updated with new data, and can accurately predict future market, industry and sector performance.