
Wall Street kicked off the new week on shaky footing as both stocks and bonds opened down. The pullback comes after technically overbought conditions persisted due to the huge rally in November. Megacap growth names were taking the brunt of the damage as we are starting to see a slight rotation out of the major winners of 2023.

This Week on Wall Street - Week of December 4th
Market Commentary
Wall Street kicked off the new week on shaky footing as both stocks and bonds opened down. The pullback comes after technically overbought conditions persisted due to the huge rally in November. Megacap growth names were taking the brunt of the damage as we are starting to see a slight rotation out of the major winners of 2023.
It's jobs week on Wall Street where we will get more data on unemployment changes and job openings. On Friday, the estimate is for 190,000 jobs added which is up from the previous read of 150,000. Digging in more, estimates are calling for a 3.9% unemployment rate, no change from last month. What this means is estimates are calling for a Goldilocks report where jobs are still being added, but not too many that could put upward pressure on wages and inflation.
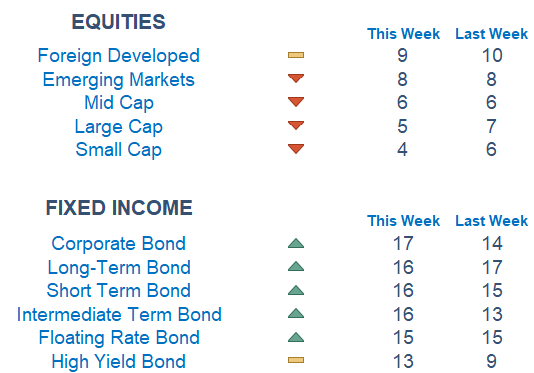
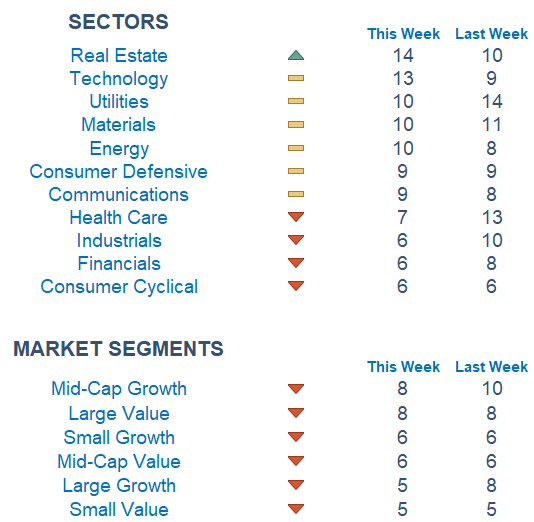
Newton scores on the equity front are still weak as foreign markets remain relatively stronger. Our models are picking up strength in Real Estate among sectors.
Economic Releases This Week
Monday: Factory Orders
Tuesday: S&P US Services PMI, ISM Services, Jop Openings
Wednesday: ADP Employment, US Productivity, US Trade Deficit
Thursday: Initial Jobless Claims, Wholesale Inventories, Consumer Credit
Friday: US Employment Report
Stories to Start Your Week

What is Newton?
Our Newton model attempts to determine the highest probability of future price direction by using advanced algorithmic and high-order mathematical techniques on the current market environment to identify trends in underlying security prices. The Newton model scores securities over multiple time periods on a scale of 0-20 with 0 being the worst and 20 being the best possible score. Trend & level both matter.
Technical trading models are mathematically driven based upon historical data and trends of domestic and foreign market trading activity, including various industry and sector trading statistics within such markets. Technical trading models, through mathematical algorithms, attempt to identify when markets are likely to increase or decrease and identify appropriate entry and exit points. The primary risk of technical trading models is that historical trends and past performance cannot predict future trends and there is no assurance that the mathematical algorithms employed are designed properly, updated with new data, and can accurately predict future market, industry and sector performance.