
Week of February 12th

This Week on Wall Street - Week of February 12th
Market Commentary
Stocks and bonds slipped to start the new week after the hotter-than-expected inflation report this morning. The S&P 500 fell back below 5,000 while the 10YR yield climbed to near 4.3%.
The consumer price index increased 0.3% as shelter costs remained stubbornly high. Shelter prices account for about 33% of the CPI weighting and rose 0.6%. This report coupled with other economic data points showing a stronger-than-expected economy, has caused traders to all but abandon cuts before July.
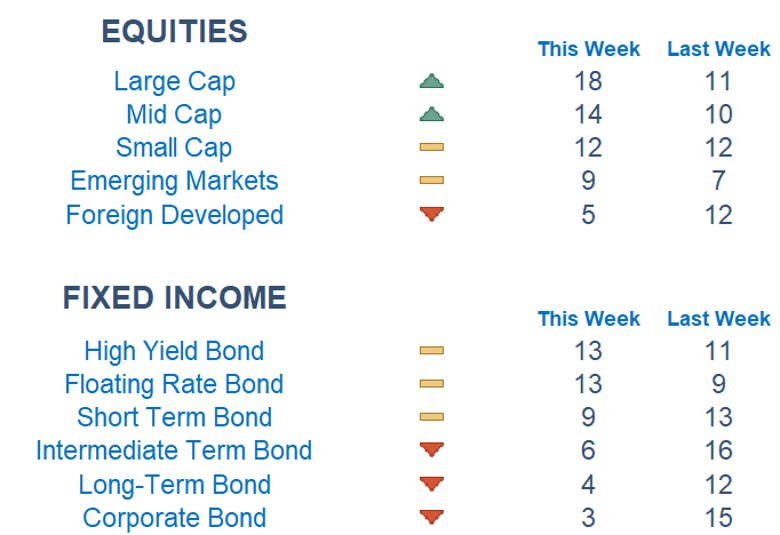
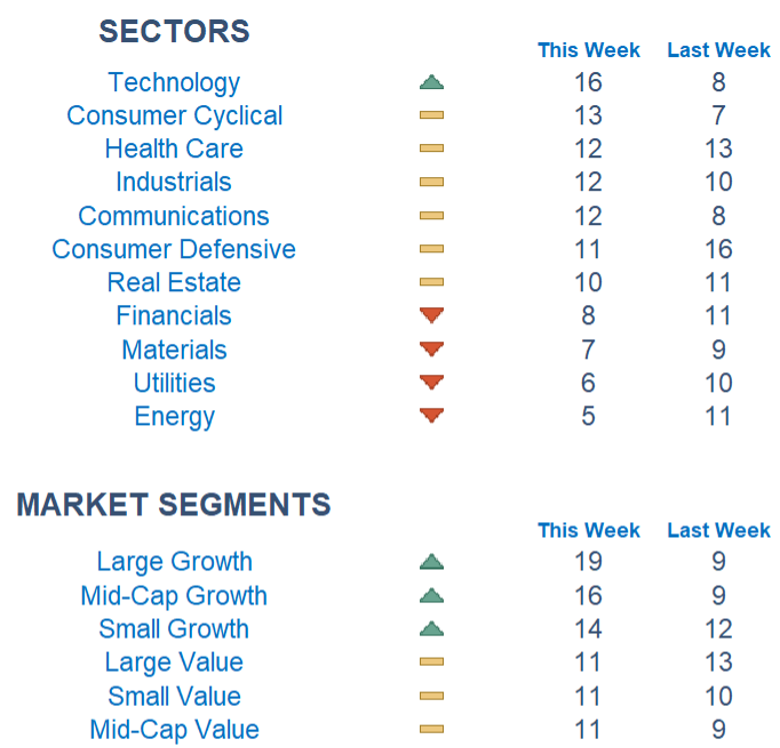
Newton scores show strength in Large Caps versus Small Caps as well as Domestic versus Foreign. On the fixed-income side, we are starting to see less strength out of the longer end of the curve as yields climb. Beneath the surface, Technology and Consumer Cyclical are on top. Energy and Utilities are now sitting at the bottom of the stack.
Stories to Start the Week
It's time for Tiger Woods' next chapter as Taylormade announces their new Sun Day Red brand.
Super Bowl LVIII was the most-watched telecast of all time, reaching 123.7 million viewers.
The men's marathon world record holder, Kenya's Kelvin Kiptum has died at 24 in a road accident.
The most expensive home for sale in the US hit the market this week for $295 million.
Economic Releases This Week
Monday: Fed Gov. Bowman Speaks, Richmond Fed President Barkin Speaks, Minneapolis Fed President Kashkari Speaks
Tuesday: Consumer Price Index, Core CPI
Wednesday: Chicago Fed President Goolsbee Speaks
Thursday: Initial Jobless Claims, Philadelphia Fed Manufacturing Survey, US Retail Sales, Home Builder Confidence Index, Industrial Production, Fed Gov. Waller Speaks, Atlanta Fed President Bostic Speaks
Friday: Housing Starts, Building Permits, Producer Price Index, Consumer Sentiment, SF Fed President Daly Speaks

What is Newton?
Our Newton model attempts to determine the highest probability of future price direction by using advanced algorithmic and high-order mathematical techniques on the current market environment to identify trends in underlying security prices. The Newton model scores securities over multiple time periods on a scale of 0-20 with 0 being the worst and 20 being the best possible score. Trend & level both matter.
Technical trading models are mathematically driven based upon historical data and trends of domestic and foreign market trading activity, including various industry and sector trading statistics within such markets. Technical trading models, through mathematical algorithms, attempt to identify when markets are likely to increase or decrease and identify appropriate entry and exit points. The primary risk of technical trading models is that historical trends and past performance cannot predict future trends and there is no assurance that the mathematical algorithms employed are designed properly, updated with new data, and can accurately predict future market, industry and sector performance.