
We hope everyone enjoyed the big game last night. Only 205 more days until the 2023 season kicks off!

This Week on Wall Street - Week of February 13th
Market Commentary
We hope everyone enjoyed the big game last night. Only 205 more days until the 2023 season kicks off!
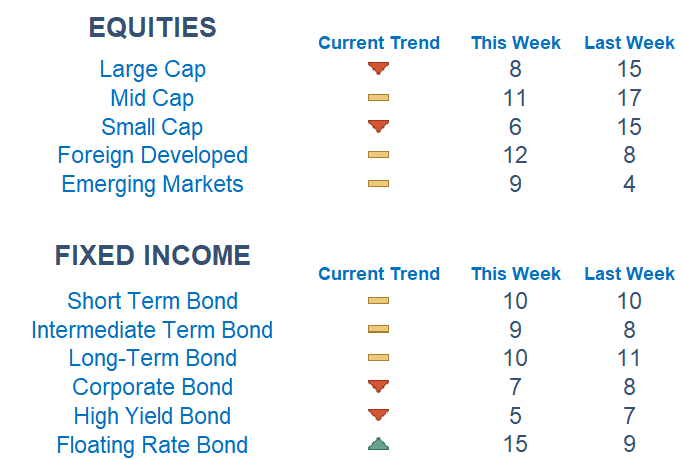
After an extremely choppy week, newtons have picked up decreased momentum in risk on markets as the dollar and interest rates begin to find support. Trend and level of the score both matter and we will be watching to see if this shift in risk holds. Our newton models favor value over growth for a second week in a row.
Given the furious rally in beaten-down areas, and as defensives took a back seat, markets seemed priced for a perfect landing going into last week. A degree of caution has entered the arena and investors are waiting for more information on inflation (CPI Report is out Tuesday) and the economy (Retail Sales are out Wednesday) before making bets one way or another.
On top of earnings, markets have been digesting the slightly dovish tone out of Powell and the hotter jobs report which is injecting large amounts of short-term volatility in markets. On Wall Street, good news can actually be bad news for stocks as a robust labor market can encourage the Fed to stay tighter for longer.
We talked about the key support area of 4,100 heading into last week as it is a huge battleground area for bulls and bears. After crossing through the threshold on Thursday, a late Friday push from the bulls got the index back to that level.
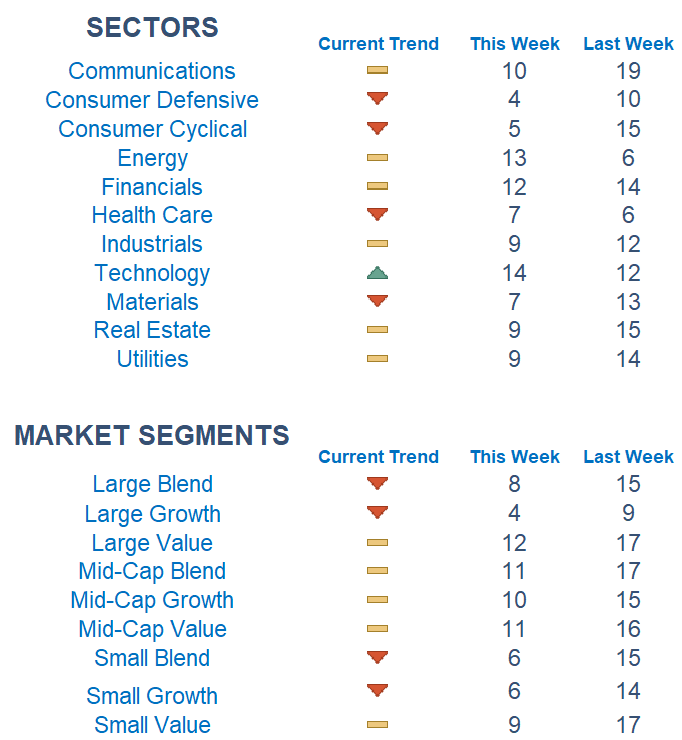
Among sectors, Technology is graded out on top while energy is trending higher. Picking names with relative strength within sectors has remained the dominant and most effective strategy.
What is Newton?
r Newton model attempts to determine the highest probability of future price direction by using advanced algorithmic and high-order mathematical techniques on the current market environment to identify trends in underlying security prices. The Newton model scores securities over multiple time periods on a scale of 0-20 with 0 being the worst and 20 being the best possible score. Trend & level both matter.
Economic Releases This Week
Monday: NY Fed Inflation Expectations
Tuesday: Consumer Price Index
Wednesday: Retail Sales, Industrial Production Index, NAHB Homebuilders' Index
Thursday: Initial & Continuing Jobless Claims, Building Permits, Housing Starts
Friday: Index of Leading Economic Indicators, Import Price Index
Technical trading models are mathematically driven based upon historical data and trends of domestic and foreign market trading activity, including various industry and sector trading statistics within such markets. Technical trading models, through mathematical algorithms, attempt to identify when markets are likely to increase or decrease and identify appropriate entry and exit points. The primary risk of technical trading models is that historical trends and past performance cannot predict future trends and there is no assurance that the mathematical algorithms employed are designed properly, updated with new data, and can accurately predict future market, industry and sector performance.