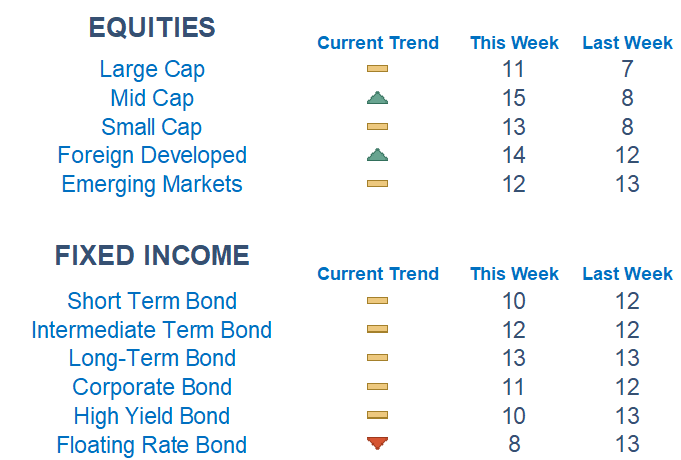
On the shortened trading week, our Newton models are starting to show strength in equities while fixed-income areas remain mostly unchanged.

This Week on Wall Street - Week of January 17th
Market Commentary
On the shortened trading week, our Newton models are starting to show strength in equities while fixed-income areas remain mostly unchanged. The models show more relative strength out of smaller-sized companies compared to larger sized. Additionally, overseas markets remain a bright spot for the fourth week in a row.
We saw more constructive price action last week from the technical side. Markets furthered their march out of the extremely tight range they found themselves in for most of December and early January. Traders' fears were eased as they saw that inflation continued to come down which helped the S&P 500 return to a very important level once again, the downward sloping trend line and 200-day moving average.
Throughout last year we saw multiple rallies to these key levels before selling off to lower lows. Now, as we see breadth expansion and some better data on inflation, it will be interesting to see if we can buck the trend and continue on for a sustainable and investable rally. Though we have cleared some short-term hurdles recently, the next big one is likely 4,100 on the S&P 500. The fear index, or the VIX, is near one-year lows, which could mean complacency has crept into the market as short-sellers and hedgers have been forced to unwind positions.
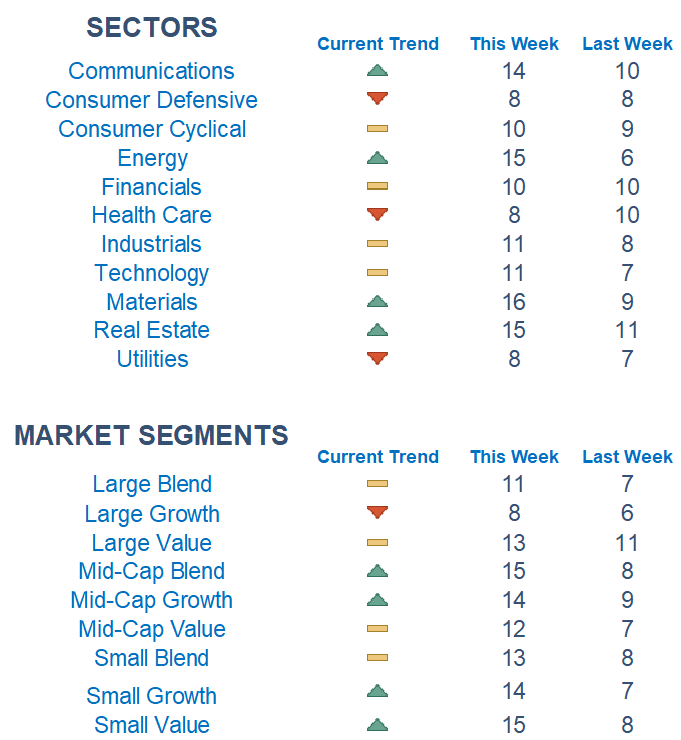
Among sectors, the trend favors Materials, Energy, and Real Estate names while more defensive sectors like Staples, Health Care, and Utilities are grading out poorly. Picking names with relative strength within sectors has remained the dominant and most effective strategy.

What is Newton?
Our Newton model attempts to determine the highest probability of future price direction by using advanced algorithmic and high-order mathematical techniques on the current market environment to identify trends in underlying security prices. The Newton model scores securities over multiple time periods on a scale of 0-20 with 0 being the worst and 20 being the best possible score. Trend & level both matter.

Economic Commentary
Economic data is housing heavy this weak with reports on the NAHB home builders' index, housing starts, building permits, and existing home sales. The sector has been crushed over the last year and investors are looking for signs of a bottom on the horizon. Forecasters are calling for a slight increase in the home builders index and existing home sales.
Economic Releases This Week
Monday: Martin Luther King Jr. Day [Markets Closed]
Tuesday: Empire State Manufacturing Index
Wednesday: Retail Sales, PPI, Industrial Production, Beige Book, NAHB Home Builder's Index
Thursday: Initial Jobless Claims, Continuing Jobless Claims, Housing Starts, Philly Fed Manufacturing Index, Fed Vice Chair Brainard Speaks
Friday: Existing Homes Sales

Technical trading models are mathematically driven based upon historical data and trends of domestic and foreign market trading activity, including various industry and sector trading statistics within such markets. Technical trading models, through mathematical algorithms, attempt to identify when markets are likely to increase or decrease and identify appropriate entry and exit points. The primary risk of technical trading models is that historical trends and past performance cannot predict future trends and there is no assurance that the mathematical algorithms employed are designed properly, updated with new data, and can accurately predict future market, industry and sector performance.
