
After the extremely volatile shortened trading week our Newton models have started to show deterioration.

This Week on Wall Street - Week of January 23rd
Market Commentary
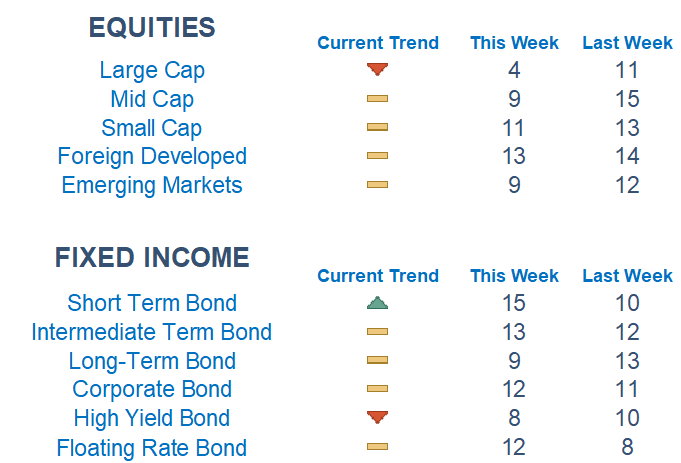
After the extremely volatile shortened trading week our Newton models have started to show deterioration. The models favor smaller-sized companies compared to large caps once again while overseas markets remain a bright spot for the fifth week in a row. Short-term duration is grading out relatively better, likely due to investors pricing in a more dovish fed, on the margin, in the months ahead.
We saw less constructive price action as we came out of the gates last week. The index couldn't push through the very important downtrend line and 200-day moving average and remained pinned in a tight, yet volatile, trading range. Bulls and bears are in a battle on positioning and we will hopefully get more certainty on who ultimately triumphs this week.
As we pointed out last Tuesday, breadth expansion has been positive in the new year but we are now reverting from severely overbought readings, which could mean selling pressure as investors take profits in the short term. The fear index, or the VIX, is starting to creep back up from yearly lows, which implies further volatility in the weeks ahead.
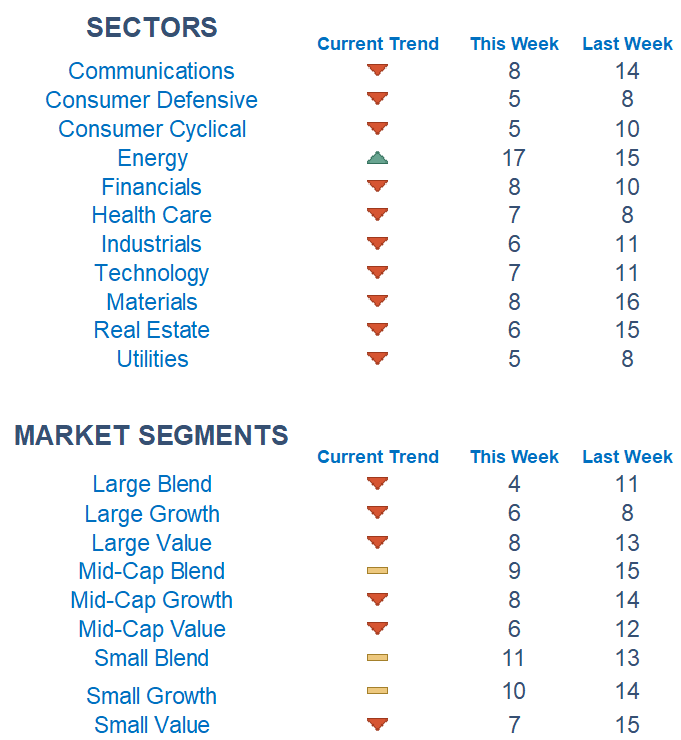
Among sectors, the only area screening out well according to Newton is Energy. Picking names with relative strength within sectors has remained the dominant and most effective strategy.
What is Newton?
Our Newton model attempts to determine the highest probability of future price direction by using advanced algorithmic and high-order mathematical techniques on the current market environment to identify trends in underlying security prices. The Newton model scores securities over multiple time periods on a scale of 0-20 with 0 being the worst and 20 being the best possible score. Trend & level both matter.
Economic Commentary
We get news on both the economic and inflation front this week. Notably, we will get the first estimate for GDP for the fourth quarter of 2022. Expectations are for growth of 2.8%. On Friday, we get the Fed's preferred measure of inflation, the PCE Price Index. Investors will be keyed in on how much the Fed's tightening cycle is flowing through the economy and if the data starts hinting more towards a hard or soft landing. Fed speak has been abundant the last week and it will remain difficult to sort out the noise and signals.
Economic Releases This Week
Monday: Leading Economic Indicators
Tuesday: Flash S&P Manufacturing & Services PMIs
Wednesday: None Scheduled
Thursday: Initial & Continuing Jobless Claims, GDP, New Home Sales
Friday: Consumer Spending, PCE Price Index, UMich Inflation Expecations
Technical trading models are mathematically driven based upon historical data and trends of domestic and foreign market trading activity, including various industry and sector trading statistics within such markets. Technical trading models, through mathematical algorithms, attempt to identify when markets are likely to increase or decrease and identify appropriate entry and exit points. The primary risk of technical trading models is that historical trends and past performance cannot predict future trends and there is no assurance that the mathematical algorithms employed are designed properly, updated with new data, and can accurately predict future market, industry and sector performance.