
After a shaky first week in markets, we started the week on a positive footing with tech surging on Monday. Still, our Newton models show deterioration for the second straight week across broad markets. A hotter-than-expected labor market, overbought conditions, and a heavier supply of debt from corporations and the government are all likely causes.

This Week on Wall Street - Week of January 9th
Market Commentary
After a shaky first week in markets, we started the week on a positive footing with tech surging on Monday. Still, our Newton models show deterioration for the second straight week across broad markets. A hotter-than-expected labor market, overbought conditions, and a heavier supply of debt from corporations and the government are all likely causes.
Investors are now awaiting a key US inflation report on Thursday, where estimates call for 3.2% YoY compared to the previous 3.1% read. In core CPI, which excludes the more volatile food and energy, estimates call for a decrease to 3.8% from 4%. A slight disinflationary trend is likely to be observed through the first months of the year given the base effects from last year and a fall in shelter inflation. Shelter inflation is nearly a third of overall CPI.
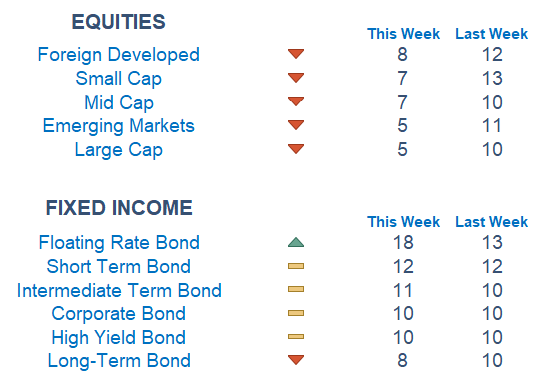
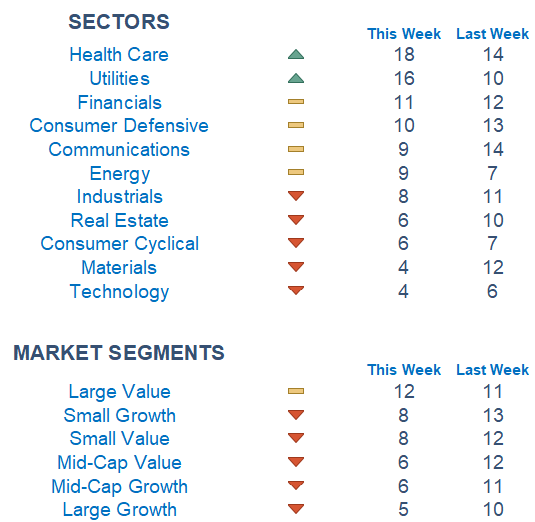
Newton scores show some relative performance from fixed income compared to equities. Diving deeper, some value areas and names that were pushed to the wayside in 2023 are on top in scores. Health Care and Utilities are on top while Technology and Materials lag the most. The same story can be observed with Large Cap Growth at the bottom of the pile instead of Value.
Economic Releases This Week
Monday: Consumer Credit
Tuesday: Trade Deficit
Wednesday: Wholesale Inventories, New York Fed President John Williams Speaks
Thursday: Initial Jobless Claims, Consumer Price Index, Richmond Fed President Barkin Speaks, Budget Statement
Friday: Producer Price Index, Minneapolis Fed President Kashkari Speaks
What is Newton?
Our Newton model attempts to determine the highest probability of future price direction by using advanced algorithmic and high-order mathematical techniques on the current market environment to identify trends in underlying security prices. The Newton model scores securities over multiple time periods on a scale of 0-20 with 0 being the worst and 20 being the best possible score. Trend & level both matter.
Technical trading models are mathematically driven based upon historical data and trends of domestic and foreign market trading activity, including various industry and sector trading statistics within such markets. Technical trading models, through mathematical algorithms, attempt to identify when markets are likely to increase or decrease and identify appropriate entry and exit points. The primary risk of technical trading models is that historical trends and past performance cannot predict future trends and there is no assurance that the mathematical algorithms employed are designed properly, updated with new data, and can accurately predict future market, industry and sector performance.