
Our Newton models continue to show poor readings for equity indices.

This Week on Wall Street - Week of January 9th
Market Commentary
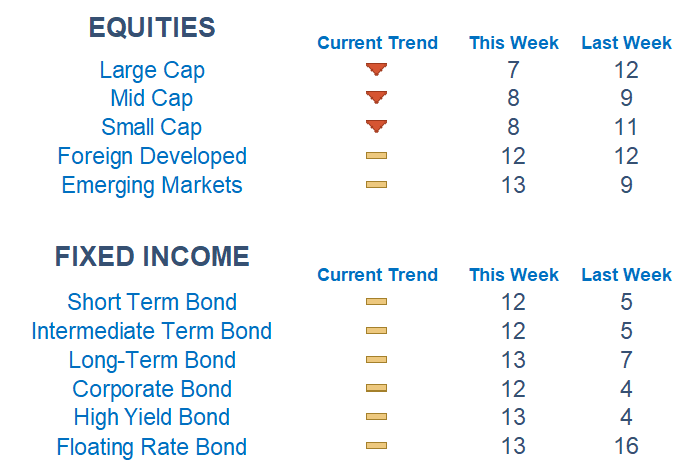
Our Newton models continue to show poor readings for equity indices. However, the bright spot for the last few trading weeks has been overseas markets relative to domestic. Fixed income is starting to grade out better as interest rates across the curve temper due to fears of a growth slowdown and a fall in inflation expectations.
Markets, for the better part of two weeks, have been in an extremely tight yet choppy range. Friday, investors cheered the job report pushing the index outside of the top end of the range. We now have some work to do in order to see if this is just another test to resistance, or something more. Investors will likely be glued in on 3,900 on the index level while that key level also happens to overlap with the 50-day moving average.
With the CPI report Thursday, expect elevated volatility as traders dissect the numbers. The end of the week will likely give us more certainty on whether this short-term move higher, which started Friday, is lasting or if it is yet another fake-out in this volatile trading market.
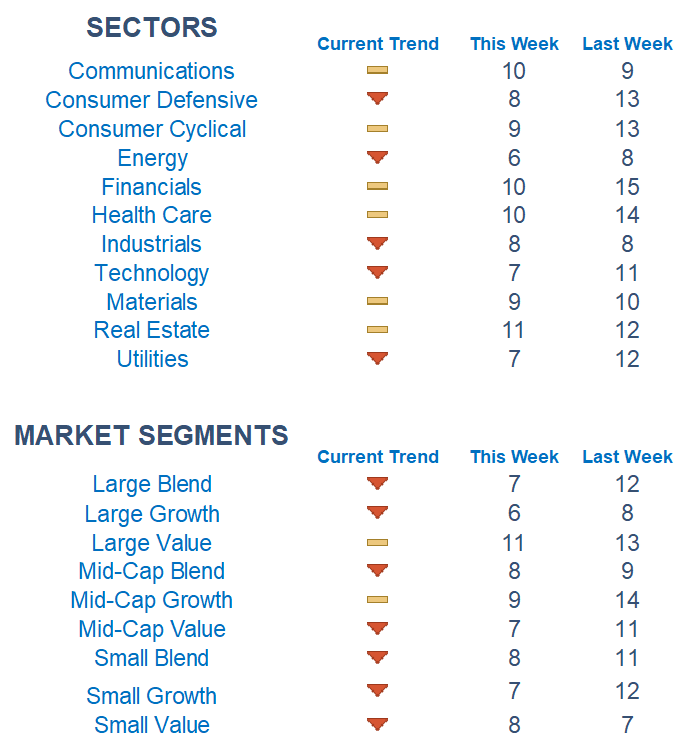
Beneath the surface, there isn't any trend as we are not seeing any strength out of any particular sector or theme. Although value has a slight edge over growth. Picking names with relative strength within sectors has remained the dominant and most effective strategy.
What is Newton?
Our Newton model attempts to determine the highest probability of future price direction by using advanced algorithmic and high-order mathematical techniques on the current market environment to identify trends in underlying security prices. The Newton model scores securities over multiple time periods on a scale of 0-20 with 0 being the worst and 20 being the best possible score. Trend & level both matter.
Economic Commentary
The report on everyone's radar will be the inflation number that comes out on Thursday morning. Investors will be looking to see if inflation continues to come down due to the Fed's hiking cycle. The last report showed inflation rose 0.1% over the month and 7.1% year-over-year. We peaked at 9.1% in June. Wall Street is expecting the number to come in at 6.6%.
Economic Releases This Week
Monday: NY Fed Inflation Expectations, Atlanta Fed President Raphael Bostic Speaks, Consumer Credit
Tuesday: NFIB Small Business Index, Jerome Powell Sp
Wednesday: Pending Home Sales Index
Thursday: Initial Jobless Claims, Continuing Jobless Claims, Consumer Price Index, Federal Budget, Fed Speak
Friday: UMich Consumer Sentiment Index, Import Price Index
Technical trading models are mathematically driven based upon historical data and trends of domestic and foreign market trading activity, including various industry and sector trading statistics within such markets. Technical trading models, through mathematical algorithms, attempt to identify when markets are likely to increase or decrease and identify appropriate entry and exit points. The primary risk of technical trading models is that historical trends and past performance cannot predict future trends and there is no assurance that the mathematical algorithms employed are designed properly, updated with new data, and can accurately predict future market, industry and sector performance.