
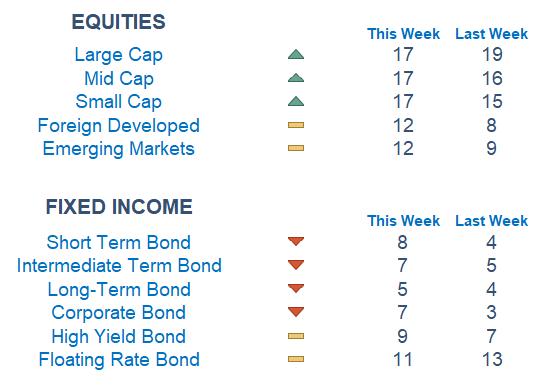
All 3 major market cap indices have high Newton scores, a positive signal. However, if we dig a little deeper we notice that Small Caps have a slight edge as the rate of change is increasing compared to Large Caps. Overseas, we observe neutral readings with increasing momentum. Our models are still favoring equities over fixed income.

This Week on Wall Street - Week of July 17th
Market Commentary
All 3 major market cap indices have high Newton scores, a positive signal. However, if we dig a little deeper we notice that Small Caps have a slight edge as the rate of change is increasing compared to Large Caps. Overseas, we observe neutral readings with increasing momentum. Our models are still favoring equities over fixed income.
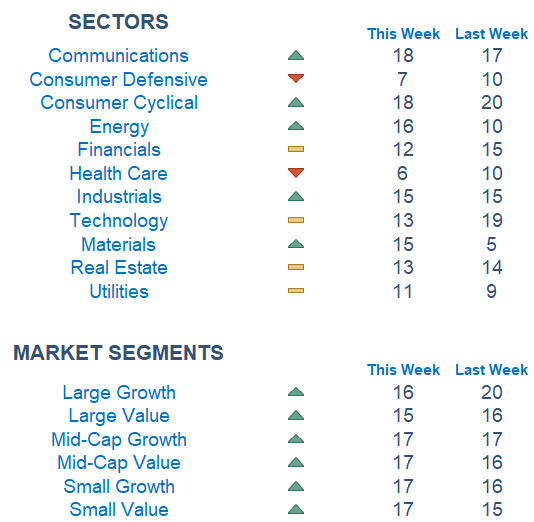
Among sectors, we are seeing Discretionary, Communications, and Energy on top. Health Care and Staples are at the bottom of the pile.
The inflation readings last week could help the market set a foundation as we head into Q2 earnings season on better hopes of a soft landing. Hundreds of companies will report over the next few weeks and S&P 500 firms are expected to post a drop of 9% in profits, the worst season since 2020. Overseas in Europe, the number stands at a slump of 12%. Still, investors will be looking to bid companies that can beat these lowered hurdles.
It is a quieter week on the economic data front with Retail Sales at the forefront tomorrow. This morning we received more evidence pointing to a slowdown in China as the world's second-largest economy grew less than expected. Many investors are wondering how much the slowdown will spill over to the United States and other major economies across the globe.
What is Newton?
Our Newton model attempts to determine the highest probability of future price direction by using advanced algorithmic and high-order mathematical techniques on the current market environment to identify trends in underlying security prices. The Newton model scores securities over multiple time periods on a scale of 0-20 with 0 being the worst and 20 being the best possible score. Trend & level both matter.
Economic Releases This Week
Monday: Empire State Manufacturing Survey
Tuesday: Retail Sales, Home Builder Confidence Index
Wednesday: Housing Starts
Thursday: Initial & Continuing Jobless Claims, Existing Home Sales, US Leading Economic Indicators
Friday: None
Technical trading models are mathematically driven based upon historical data and trends of domestic and foreign market trading activity, including various industry and sector trading statistics within such markets. Technical trading models, through mathematical algorithms, attempt to identify when markets are likely to increase or decrease and identify appropriate entry and exit points. The primary risk of technical trading models is that historical trends and past performance cannot predict future trends and there is no assurance that the mathematical algorithms employed are designed properly, updated with new data, and can accurately predict future market, industry and sector performance.