
It's a data-packed week after a stronger-than-expected jobs report last Friday. Equities opened up lower while bonds were little changed.

This Week on Wall Street - Week of March 11th
Market Commentary
It's a data-packed week after a stronger-than-expected jobs report last Friday. Equities opened up lower while bonds were little changed.
Currently, traders are pricing in a June rate cut as a definite, even with the stronger payroll data Friday. On Tuesday, we get another read on inflation with the Consumer Price Index. The bulls will be hoping that the number comes in lighter than the expected 3.1% YoY estimate. If we see a hotter number due to the stickiness in the service sector, it could derail confidence that the Fed is on track to cut in mid-summer.
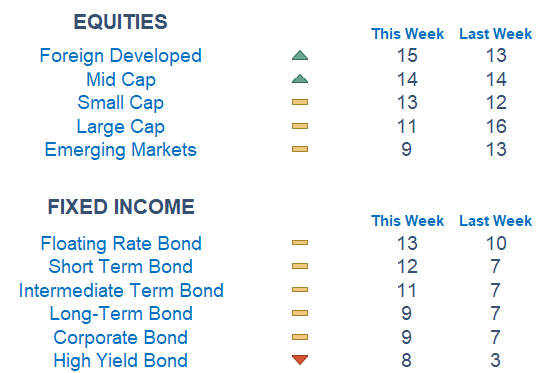
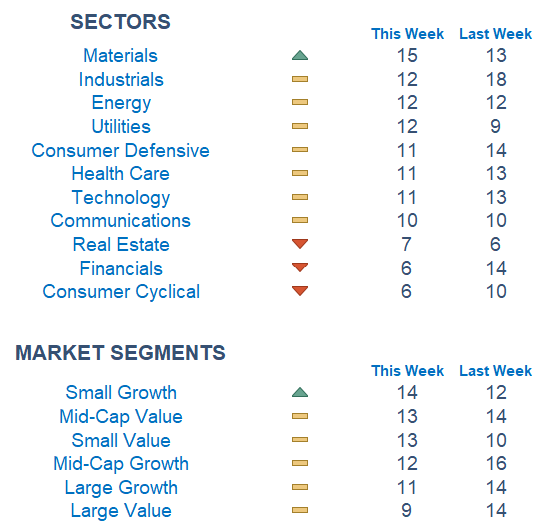
We are seeing a rotation away from large caps and domestic names and into their smaller counterparts and foreign parts of the market. Materials are the strongest sector according to our Newton model while we are seeing Real Estate, Financials, and Consumer Cyclicals lag. Fixed Income is showing a nice rate of change trend as yields back down slightly.
Stories to Start the Week
Oppenheimer cleaned up at the Oscars. Here is a recap.
An experimental self-service screening system for airport security checkpoints is being unveiled this month.
Lawmakers from both parties say they are unsure whether they will support a new bill targeting TikTok in the US.
The Justice Department has opened a criminal investigation into the Boeing 737 MAX blowout on an Alaska Airlines flight.
Economic Releases This Week
Monday: None
Tuesday: NFIB Optimism Index, Consumer Price Index, Monthly US Federal Budget
Wednesday: None
Thursday: Initial Jobless Claims, US Retail Sales, Producer Price Index
Friday: Empire State Manufacturing Survey, Import Price Index, Capacity Utilization

What is Newton?
Our Newton model attempts to determine the highest probability of future price direction by using advanced algorithmic and high-order mathematical techniques on the current market environment to identify trends in underlying security prices. The Newton model scores securities over multiple time periods on a scale of 0-20 with 0 being the worst and 20 being the best possible score. Trend & level both matter.
Technical trading models are mathematically driven based upon historical data and trends of domestic and foreign market trading activity, including various industry and sector trading statistics within such markets. Technical trading models, through mathematical algorithms, attempt to identify when markets are likely to increase or decrease and identify appropriate entry and exit points. The primary risk of technical trading models is that historical trends and past performance cannot predict future trends and there is no assurance that the mathematical algorithms employed are designed properly, updated with new data, and can accurately predict future market, industry and sector performance.