
Last night, we got an answer on the fallout and where we are headed on the second-largest bank failure in the US.

This Week on Wall Street - Week of March 13th
Market Commentary
Last night, we got an answer on the fallout and where we are headed on the second-largest bank failure in the US. In a joint statement from the Fed and FDIC, we learned that depositors, even those over the $250,000 FDIC-insured limit, will have access to their money through the Deposit Insurance Fund. Shareholders in the banks are not protected. Although the backstop tempered some of the left tail risks, investors this week will be digesting this ongoing story and monitoring any contagion probabilities.
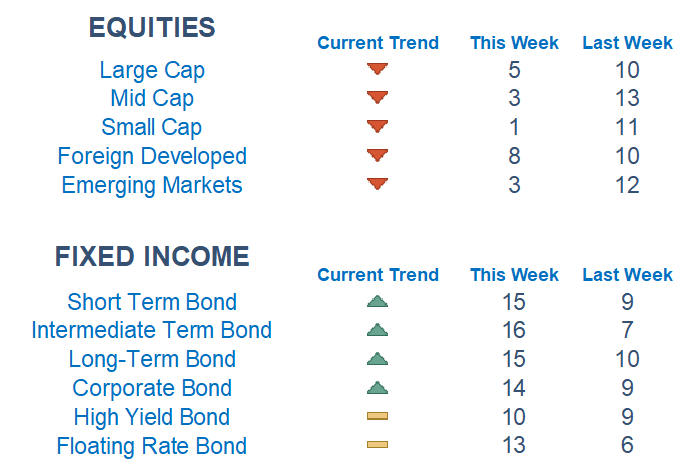
Onto our models: We are seeing a quick flip to risk-off areas as investors pile into fixed income and safety. Across the treasury curve, we are seeing yields moving strongly lower, a positive for bond prices. Large caps are stronger relative to small caps and growth is edging out value.
This banking situation has injected fresh worry on the path for the Fed's ultimate tightening cycle plan. Probabilities for a 50bps hike at the next meeting have fallen off a cliff given the thought the Fed will now be forced to stop in the face of turmoil in bank stocks. On Tuesday we get an important read on inflation and will get an incremental amount of clarity on the hiking cycle trajectory.
We ended the week slicing through the 200-day moving average on the index level and will be watching the 3,800 level for the next support area. Breadth is very poor and starting to approach short-term oversold levels.
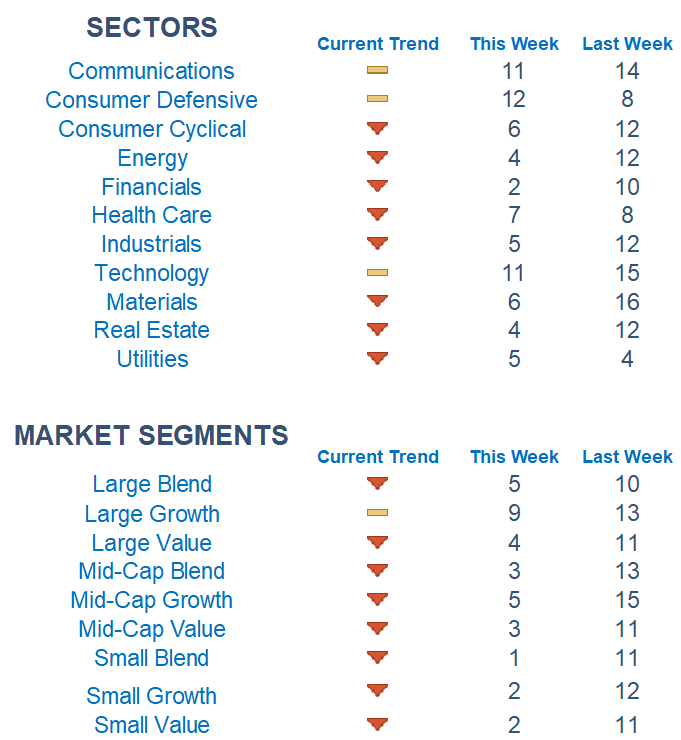
Among sectors, we are seeing strength in Technology, Communications, and Staples while Financials, Real Estate, and Energy are grading out the weakest. Picking names with relative strength within sectors has remained the dominant and most effective strategy.
What is Newton?
r Newton model attempts to determine the highest probability of future price direction by using advanced algorithmic and high-order mathematical techniques on the current market environment to identify trends in underlying security prices. The Newton model scores securities over multiple time periods on a scale of 0-20 with 0 being the worst and 20 being the best possible score. Trend & level both matter.
Economic Releases This Week
Monday: None
Tuesday: Consumer Price Index
Wednesday: Retail Sales, Producer Price Index, Homebuilders Survey
Thursday: Initial & Continuing Jobless Claims, Housing Starts
Friday: Industrial Production, US Leading Economic Index, Consumer Sentiment
Technical trading models are mathematically driven based upon historical data and trends of domestic and foreign market trading activity, including various industry and sector trading statistics within such markets. Technical trading models, through mathematical algorithms, attempt to identify when markets are likely to increase or decrease and identify appropriate entry and exit points. The primary risk of technical trading models is that historical trends and past performance cannot predict future trends and there is no assurance that the mathematical algorithms employed are designed properly, updated with new data, and can accurately predict future market, industry and sector performance.