
We enter the week with equities rebounding after a slow burn of selling throughout last week. Big tech is leading the gains as the dollar falls. Over the last 6 weeks, the S&P 500 has been down 4 of them. Still, the index is up double digits on the year.

This Week on Wall Street - Week of September 11th
Market Commentary
We enter the week with equities rebounding after a slow burn of selling throughout last week. Big tech is leading the gains as the dollar falls. Over the last 6 weeks, the S&P 500 has been down 4 of them. Still, the index is up double digits on the year.
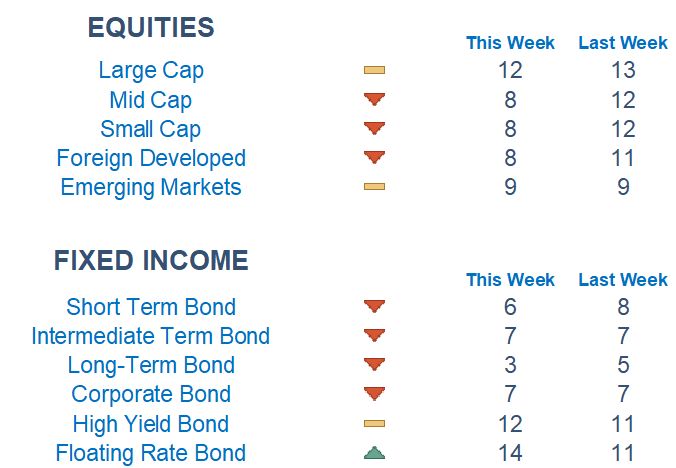
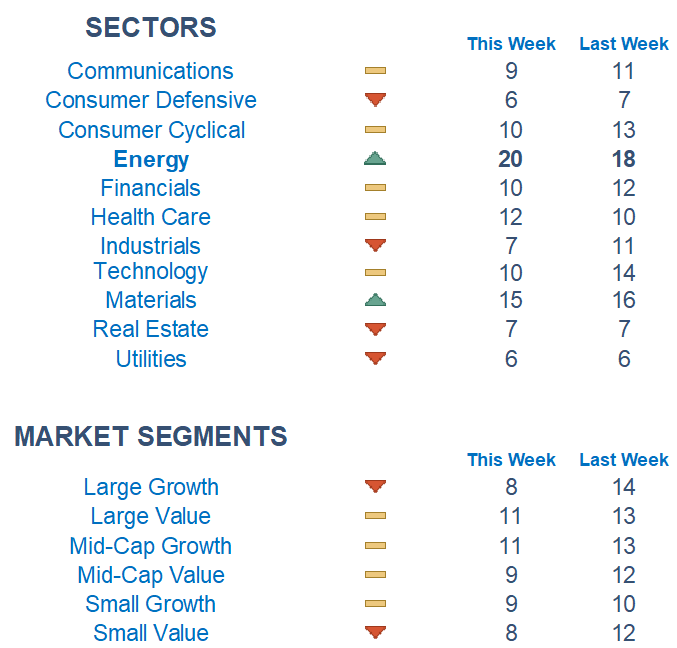
Newton scores are weakening given the selling pressure from last week. Large caps hold a slight advantage over their smaller capitalization counterparts. Across the pond, foreign markets are weaker. As interest rates climbed higher, bonds also deteriorated. Energy is still the strongest sector according to Newton while interest rate-sensitive sectors like Real Estate and Utilities are at the bottom.
On the economic front: This week we get an important report on inflation. The CPI read is expected to come in at 0.5% month over month, compared to the prior 0.2%. For YoY, the consensus is 3.5% vs. the prior 3.2%. The expected rise can, in part, be attributed to rising gasoline prices. If we get a hotter-than-expected number, the odds of another Fed hike by year-end will likely go up. The main thing for investors to monitor will be the trend in core inflation and inflation expectations.
A quick note on the Fed: We are entering the blackout period ahead of next week's meeting. All signals point to the Fed holding rates steady as the odds of a hike stand at only 7%.
Economic Releases This Week
Monday: None
Tuesday: NFIB Optimism Index, US Federal Budget
Wednesday: Consumer Price Index
Thursday: Initial & Continuing Jobless Claims, Producer Price Index, Retail Sales
Friday: US Import Prices, Empire State Manufacturing Survey, Industrial Production, Capacity Utilization, Consumer Sentiment
Stories to Start Your Week
Qualcomm rose after Apple extended a deal with the chipmaker
Tesla jumped after Morgan Stanley predicts Dojo supercomputer could add $500B in market value
Charter and Disney reached a rights deal
Morocco Earthquake toll nears 2,700 as rescuers scramble for survivors
UAW is ready to negotiate around the clock as the strike deadline nears
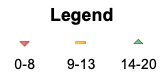
What is Newton?
Our Newton model attempts to determine the highest probability of future price direction by using advanced algorithmic and high-order mathematical techniques on the current market environment to identify trends in underlying security prices. The Newton model scores securities over multiple time periods on a scale of 0-20 with 0 being the worst and 20 being the best possible score. Trend & level both matter.
Technical trading models are mathematically driven based upon historical data and trends of domestic and foreign market trading activity, including various industry and sector trading statistics within such markets. Technical trading models, through mathematical algorithms, attempt to identify when markets are likely to increase or decrease and identify appropriate entry and exit points. The primary risk of technical trading models is that historical trends and past performance cannot predict future trends and there is no assurance that the mathematical algorithms employed are designed properly, updated with new data, and can accurately predict future market, industry and sector performance.