
We enter the week with equities flat to down. This comes after the Fed's hawkish pause last week causing investors to readjust expectations on the path of rates. The bond market selloff entered its fourth week as the 10-year treasury yield breaks past 4.5%, the highest level since 2007.

This Week on Wall Street - Week of September 25th
Market Commentary
We enter the week with equities flat to down. This comes after the Fed's hawkish pause last week causing investors to readjust expectations on the path of rates. The bond market selloff entered its fourth week as the 10-year treasury yield breaks past 4.5%, the highest level since 2007.
Although September is already a weak month seasonally, markets are facing many headwinds. On the index level, we are watching the August low as support, which is under threat. If we accelerate lower, we could start to see more sellers come out of the woodwork.
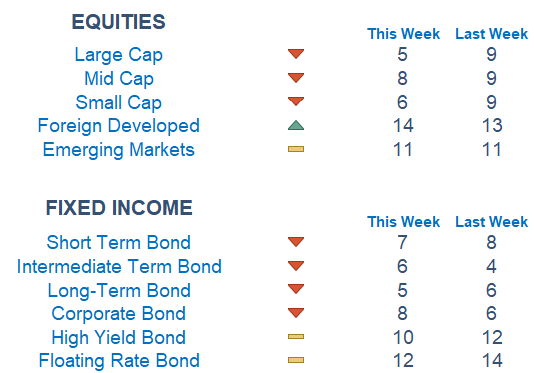
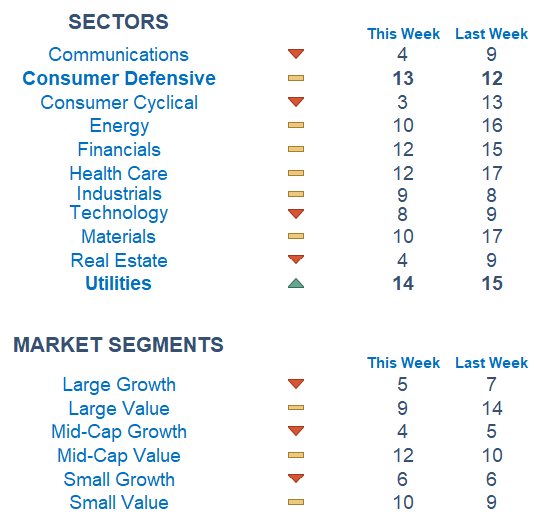
Newton scores are still weak as defensive parts of the equity markets are leading. Value is edging out growth. The short end of the Treasury curve looks relatively more attractive as interest rates climb higher. Defensives and Staples are the highest-graded sectors while Cyclicals lag the most.
On the economic front: It is a lighter week, with a very important PCE report on Friday. The data print should shed more light on the Fed's confidence in softening price pressures. This inflation read is the Fed's preferred gauge and it likely grew at a 0.2% pace versus the prior 0.5% pace. YoY the estimate is for 3.9% vs. 4.2% the prior month.
Economic Releases This Week
Monday: None
Tuesday: New Home Sales, S&P Case Shiller Home Price Index, Consumer Confidence
Wednesday: Durable Goods
Thursday: Initial & Continuing Jobless Claims, GDP (revision), Fed Gov. Cook Speaks, Fed Chairman Powell Speaks
Friday: Personal Income, Personal Spending, PCE Index
Stories to Start Your Week
The Writers Guild of America and Hollywood's top media companies reached a tentative agreement that could resolve one of the longest walkouts in industry history.
Former President Jimmy Carter and ex-first lady Rosalynn Carter made a rare public appearance over the weekend in their Georgia hometown for the Plains Peanut Festival.
President Biden will travel to Michigan to join the picket line with UAW workers.
Netflix will end its DVD service this Friday a little more than 25 years after the company shipped its first one.
Grab a coffee and set the alarm early this weekend. The Ryder Cup kicks off in Rome on Friday.
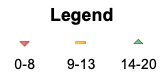
What is Newton?
Our Newton model attempts to determine the highest probability of future price direction by using advanced algorithmic and high-order mathematical techniques on the current market environment to identify trends in underlying security prices. The Newton model scores securities over multiple time periods on a scale of 0-20 with 0 being the worst and 20 being the best possible score. Trend & level both matter.
Technical trading models are mathematically driven based upon historical data and trends of domestic and foreign market trading activity, including various industry and sector trading statistics within such markets. Technical trading models, through mathematical algorithms, attempt to identify when markets are likely to increase or decrease and identify appropriate entry and exit points. The primary risk of technical trading models is that historical trends and past performance cannot predict future trends and there is no assurance that the mathematical algorithms employed are designed properly, updated with new data, and can accurately predict future market, industry and sector performance.