
Friday's jobs report print was perceived as bullish for markets during early trading. Ultimately the fade into the close going into Labor Day weekend continued during the shortened trading week. This morning we received a stronger-than-expected report on the US service industry, causing a move lower in stocks and higher in bond yields. This is on bolstered speculation that the Federal Reserve will keep rates higher for longer.

This Week on Wall Street - Week of September 5th
Market Commentary
Friday's jobs report print was perceived as bullish for markets during early trading. Ultimately the fade into the close going into Labor Day weekend continued during the shortened trading week. This morning we received a stronger-than-expected report on the US service industry, causing a move lower in stocks and higher in bond yields. This is on bolstered speculation that the Federal Reserve will keep rates higher for longer.
We will get additional insight into what direction the Fed is heading as many presidents are speaking tomorrow and Friday. Most will likely reiterate that they are looking at incoming data and that further tightening could be justified. While demand is moderating, it still is outpacing supply frustrating the Fed's 2% inflation target.
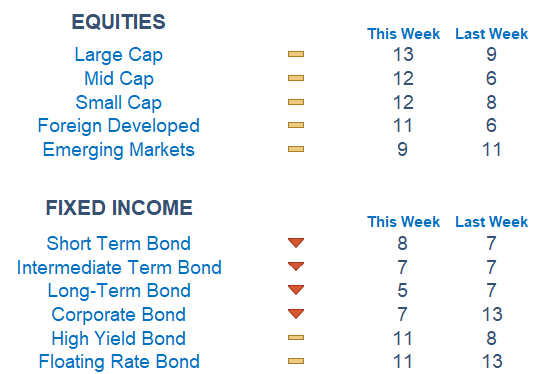
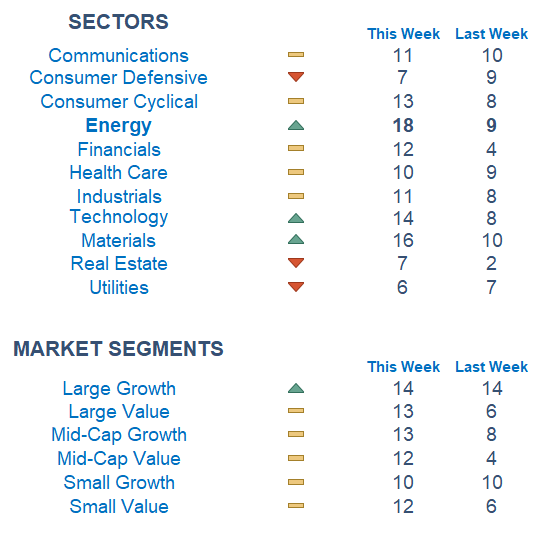
Newton scores show improvement on broad equity markets from lower levels. Bonds are still poor as interest rates continue their climb higher. Beneath the surface, Energy is the strongest sector according to Newton as oil hit its highest level since November. Traders are now digesting the decision by OPEC+ leaders Russia and Saudi Arabia to extend supply cuts through the end of the year.
Economic Releases This Week
Monday: Labor Day
Tuesday: Factory Orders
Wednesday: Boston Fed President speaks, US Trade Deficit, ISM Services, Fed Beige Book
Thursday: Initial & Continuing Jobless Claims, Fed Speak by Chicago, New York, Atlanta, Dallas Presidents
Friday: San Francisco Fed President speaks, Consumer Credit, Wholesale Inventories
What is Newton?
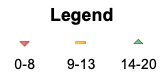
Our Newton model attempts to determine the highest probability of future price direction by using advanced algorithmic and high-order mathematical techniques on the current market environment to identify trends in underlying security prices. The Newton model scores securities over multiple time periods on a scale of 0-20 with 0 being the worst and 20 being the best possible score. Trend & level both matter.
Technical trading models are mathematically driven based upon historical data and trends of domestic and foreign market trading activity, including various industry and sector trading statistics within such markets. Technical trading models, through mathematical algorithms, attempt to identify when markets are likely to increase or decrease and identify appropriate entry and exit points. The primary risk of technical trading models is that historical trends and past performance cannot predict future trends and there is no assurance that the mathematical algorithms employed are designed properly, updated with new data, and can accurately predict future market, industry and sector performance.